quarta-feira, 23 de novembro de 2011

Application Lifecycle Management: Microsoft Project Server 2010 and Microsoft Team Foundation Server 2010

Criar um KPI relatório Detalhes usando o Dashboard Designer

Usando PerformancePoint Dashboard Designer, você pode criar um KPI relatório Detalhes para o seu dashboard. Detalhes relatórios KPI são usados ​​para mostrar informações adicionais sobre os KPIs e outros itens que estão em um scorecard. O relatório Detalhes KPI serve como um companheiro para um scorecard. Isto significa que um KPI relatório Detalhes não é usado em um painel sem o seu scorecard que acompanha na página de dashboard mesmo. Para mais informações, consulte Visão geral do PerformancePoint Detalhes relatórios KPI. Você pode criar um único relatório de KPI Detalhes e depois reutilizá-lo em vários painéis.

Para criar um KPI Detalhes relatório

1. Na faixa de opções, clique na guia Criar. Então, no grupo Relatórios, clique em Detalhes KPI. O relatório é aberto para edição.

2. No painel central, clique na guia Editor. Lá, você pode especificar as informações que você deseja exibir no relatório.


KPI section Option Description
Cell Context InformationShow cell context informationSelect this option to display the following information:
  • Metric
  • Measure
  • Row Path, which corresponds to the scorecard row that was clicked.
  • Column Path, which corresponds to the scorecard column that was clicked.
Expand cell context sections by defaultBy default, this option is selected. It causes the KPI Details report to be expanded to display the information that you specify.
Show Indicator OptionsShow status graphDo not use this option. It does not work in the current version of PerformancePoint Services.
Show indicator graphicDo not use this option. It does not work in the current version of PerformancePoint Services.
Show Details InformationShow actualSelect this option to display actual values when cells in the scorecard's Target column are clicked.
Show calculationSelect this option to display how scores are calculated and what banding method is used by the KPI that was clicked.
KPIs use one of the following calculations:
  • Increasing is better
  • Decreasing is better
  • Closer to target is better
Show scoreSelect this option to show raw scores when cells in the scorecard's Target column are clicked.
Show threshold gridSelect this option to determine whether to show the threshold grid when cells in the scorecard's Target column are clicked.
The threshold grid includes the following information:
  • The kind of indicator that is used by the KPI that was clicked
  • A table showing the different thresholds and performance for a KPI.
When you select Show threshold grid, you must also select one of the following two options:
  • Percentage threshold values
  • Target values adjusted for indicator threshold percentages
For metrics with normalized weighted value, show Percentage valuesSelect this option to display performance in percentages in the threshold grid.
For metrics with normalized weighted value, show Target values adjusted for indicator threshold percentagesSelect this option to display performance in numeric values in the threshold grid.
Show varianceSelect this option to show the variance from the next status threshold.
For example, if performance is slightly off target for a particular metric, the variance would be how far away the metric is from being on target.
Additional informationShow DescriptionSelect this option to display any text that was entered in the Description box for a KPI (visible on the Properties tab for a KPI in Dashboard Designer).
Show CommentsSelect this option to display any comments or annotations that have been added to a scorecard.
Depending on whether comments (or annotations) are enabled in the SharePoint Central Administration Web site, both dashboard authors and dashboard consumers can add comments to a scorecard.
  • Dashboard authors can open a scorecard for editing in Dashboard Designer and add comments by using the Edit tab.
  • Dashboard users can add comments to a scorecard in its SharePoint site by right-clicking a cell, and then clicking Comments.
Show KPI PropertiesSelect this option to display any custom properties that might have been created for each KPI (visible on the Properties tab for a KPI in Dashboard Designer).
Show Person ResponsibleSelect this option to display information about the person who is responsible for the KPI status (which is visible on the Properties tab for a KPI in Dashboard Designer).

sexta-feira, 18 de novembro de 2011

Sobre ShrePoint

Mais sobre SharePoint

sábado, 6 de agosto de 2011

Get-SPScripts : PowerShell Scripts for SharePoint: Finding site template names and ID’s in SharePoint...

Get-SPScripts : PowerShell Scripts for SharePoint: Finding site template names and ID’s in SharePoint...: "SharePoint 2010 includes the new Get-SPWebTemplate cmdlet for getting a list of site templates from the farm. You can use it by typing the ..."

terça-feira, 26 de abril de 2011

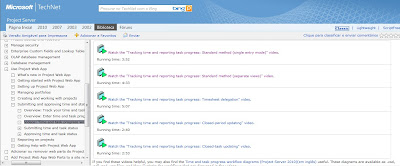
Time and task progress workflow overview

Dêem uma olhada nestes webcast falando sobre Timesheet.
Recurso incrivel no EPM 2010, vale a pena.


http://technet.microsoft.com/pt-br/library/gg609826.aspx


Até mais.

sexta-feira, 21 de janeiro de 2011

Estendendo as Propriedades de Usuário do SharePoint via BCS (Business Connectivity Services)

iQuantcast
Você pode fazer várias coisas estendendo essas propriedades de usuário do SharePoint. Pense em trazer informações dos seus recursos diretamente do seu sistema de RH ou informações dos seus clientes diretamente do seu CRM.
1. Abra o SharePoint Designer


2. Conecte-se ao seu top-level site:

3. Clique em “External Content Types” ou “Tipos de Conteúdos Externos” na barra lateral e depois no botão acima

4. Preencha os campos: “Name” e “Display Name”, pois verá esse nome durante todo o processo! J
5. Clique no link em frente ao “External System” para configurar sua conexão de dados externa.

6. Provavelmente não terá nenhuma conexão já criada.
7. Clique em “Add Connection” ou “Adicionar Conexão
a. Escolha “SQL Server” e clique em “OK

8. Preencha os campos com as informações de conexão:
a. Nome do Servidor de Banco de dados
b. Nome do Banco de Dados
c. Clique em “OK

9. Encontre sua tabela na nova conexão
10. Clique com o botão direito sobre ela e selecione “Create All Operations” para criar o CRUD
a. Sem as duas operações de “Read…” criadas não é possível concluir esse processo


11. Clique em “NEXT


12. Essa tela é altamente importante
13. Selecione a coluna/campo que será sua chave primária para fazer relação 1:1 com os dados do profile do SharePoint.
a. Neste caso escolhi o “Email” mas poderia ser o “UserAccount” ou um “ID” exclusivo da sua empresa
b. Marque a caixa “Map to Identifier” para esse campo
c. Clique em “Finish” caso não queira adicionar nenhum filtro..

14. Agora apenas verifique se está tudo ok e salve no iconezinho padrão de “Salvar

15. Vá para a “Administração Central” do SharePoint e clique em “Manage Service Applications
a. Já crie um favorito na barra de tarefas, pois sempre voltará aqui!

16. Clique sobre seu serviço de BCS.
a. Estou partindo do pressuposto de que todos os serviços já estão configurados.

17. Você verá seu Tipo de Conteúdo Externo previamente criado nessa página
18. Selecione-o e depois clique nos dois botões:
a. “Set Object Permissions
b. “Set Metadata Store Permissions
c. Um de cada vez!

19. Procure pela sua “Conta de serviço do farm SharePoint”, o seu “Farm Admin
20. Adicione-o e dê todas as permissões necessárias
21. Repita esse passo para os dois botões.


22. Agora vá para a página de “Service Applications
a. Lembra do favoritos, né?
23. Selecione o serviço de “User Profile Application

24. Em “Syncronization” clique em “Configure Synchronization Connections

25. Clique em “Create New Connection

26. Dê um nome para sua conexão, selecione o tipo “Business Data Connectivity
27. Em “Connection Settings” clique no segundo ícone para selecionar sua conexão (previamente criada)
a. Selecione a conexão na janela que irá aparecer.
b. Lembre-se do nome que deu à ela anteriormente.
c. Agora em um combobox você selecionará qual propriedade do SharePoint fará o relacionamento 1:1 com seu conteúdo externo.
28. Clique em “OK


29. Volte para a página do “User Profile Service Application
30. Clique em “Manage User Properties

31. Clique em “New Property

32. Dê um nome e uma exibição à sua propriedade
33. Selecione o tipo e o tamanho dela
a. Nesse exemplo uma string de tamanho 25

34. Adicione uma descrição caso queira
35. Selecione suas politicas:
a. Obrigatório ou não
b. Deve ser exibido ou não
c. Pode ser editado ou não
d. Etc..

36. Para mapear sua propriedade basta:
a. Selecionar sua fonte de dados previamente criada
b. Selecionar o atributo que preencherá esse campo
c. Selecionar o tipo de operação
i. Nesse caso “Importação” apenas


Referência: Allan Rocha.

quarta-feira, 1 de dezembro de 2010

WebCasts por demanda de Project Server 2010

Segue uns webcasts sobre demanda para todos aproveitarem, sobre o Project Server 1010.

Demand Management overview in Project 2010 (video and white paper)

Watch a short video and download a white paper about the Demand Management capability in Microsoft Project Server 2010. Demand Management represents a deliberate attempt to reconcile and combine multiple lifecycle management tasks within a single, unified approach.

Project 2010 Quick Start Training – Demand Management

The Demand Management module of the Quick Start training covers the key components that enable the demand management functionality in Project Server 2010: Enterprise Project Types, Project workflows (Stages and Phases), Project Detail Pages, Approvals, and steps to implement your own governance process.

Portfolio Selection and analytics overview in Project 2010 (video and white paper)

Learn how new Portfolio Selection and analytical capabilities in Project Server 2010 build a bridge between value optimization and resource utilization to help organizations select project portfolios based on alignment with business strategy and resource capability.

Project 2010 Quick Start Training – Portfolio Strategy

The Portfolio Strategy module of the Quick Start training covers the process of setting up Business Drivers, aligning projects to Business Drivers, Project Prioritization, and the selection process.

Link: http://technet.microsoft.com/en-us/projectserver/ff899331.aspx